Your region: Russia
Reference on working with the page for selection of fire extinguishing stations
Start
The Wilo fire extinguishing station selection interface contains:
- Operating point value input section;
- Table with a list of available stations;
- Section with graphical display of station characteristics;
- Station search and calculation type selection section;
- Station filters section;
Operating point value input section
By default, the table displays all available extinguishing stations. To select a fire extinguishing station for a given point, you must specify the values (see Fig. 1):
- Supply Q (m3/h) - permissible values from 1 to 800 m³/h.
- Pressure H (m) - permissible values from 5 to 200 m.
- Static head H (s) permissible values from 0 to 200 s.
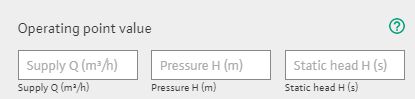
Fig. 1. Operating point value input section
After specifying all three values, the selection of suitable fire extinguishing stations will automatically occur. The table will display an updated list, where the most suitable stations will be highlighted in green (see Fig. 2).
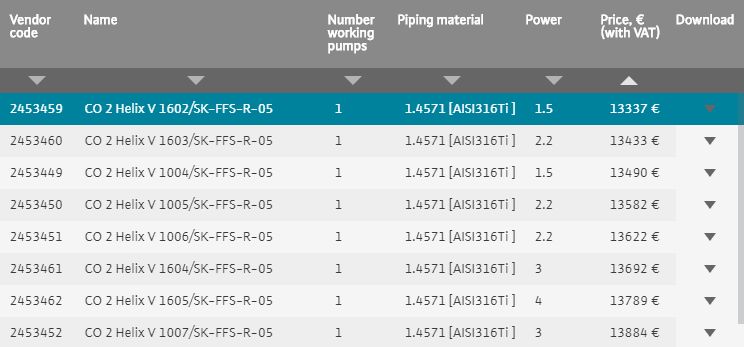
Fig. 2. Table with a list of Wilo fire extinguishing stations.
The graph will show the hydraulic curve and the practical pressure characteristic of the pumping unit according to the set operating point. (see fig. 3)
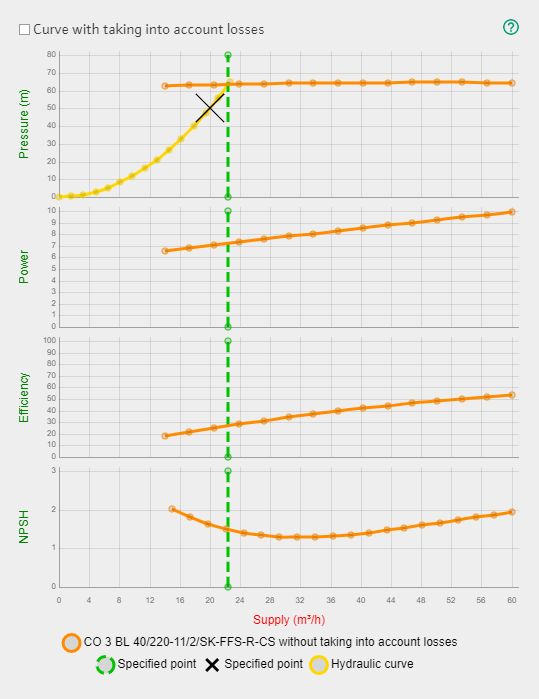
- Fig. 3. Display of the hydraulic curve and the pressure characteristic of the pumping unit.
Section with graphical display of station characteristics
The graph consists of 4 sections (Head, Power, Efficiency, NPSH). If there are no corresponding characteristics for the selected stations, the section will be hidden.
The graph displays:
- characteristics of the selected pressure station;
- hydraulic curve;
- set operating point;
- the line of intersection of the hydraulic curve and the pressure characteristic of the pumping unit;
There are several pressure characteristics of a pumping unit can be displayed on the graph (see Fig. 4):
- without taking into account losses (shown in the graph as a solid line) - combining the characteristics of individual pumps excluding losses in the collector piping;
- taking into account losses (shown in the graph by the dotted line) - the practical pressure characteristic of the pumping unit, taking into account the losses in the collector piping (based on the results of measurements on the test bench);
- the line of intersection of the hydraulic curve and the pressure characteristic of the pumping unit (shown in the graph by the dotted vertical line) - but only one for the station and depending on the selected type of calculation;
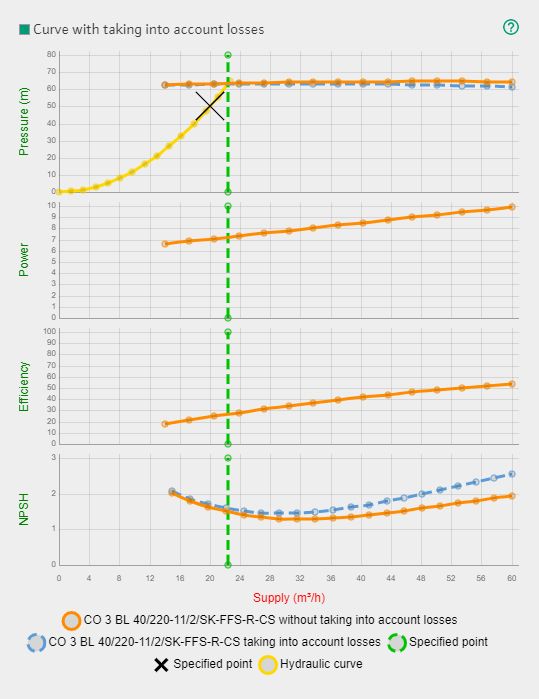
Fig. 4. Display of the practical pressure characteristic (taking into account losses), the pressure characteristic of the pumping unit (without taking into account losses) and the hydraulic curve.
To graph the practical pressure characteristic of the installation, please select “show curve -taking into account losses” on the graph as shown in fig. 4.
It is possible to display up to 5 pairs of pressure characteristics of the stations selected in the table.
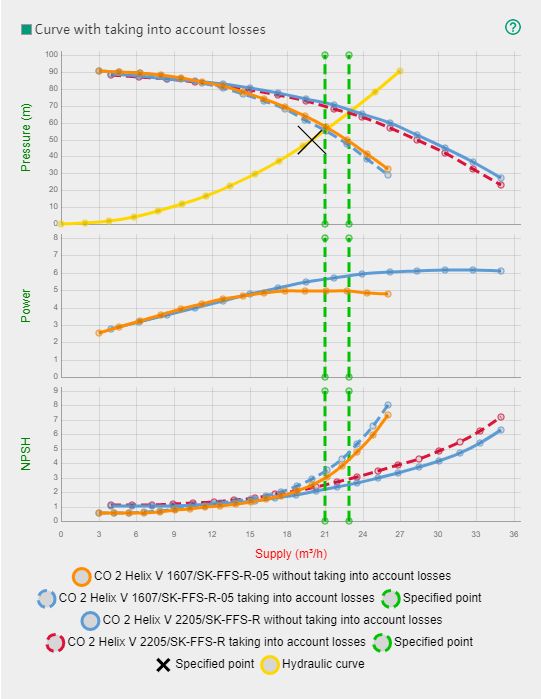
Fig. 5. Display of several pressure characteristics of stations.
To do this, hold down the "Alt" key on the keyboard and left-click the stations you need in the table.
Station search and calculation type selection section
Calculation type
In the section for selecting the type of calculation, you can specify the algorithm for selecting stations by selecting one of two options in the "Calculation type" bar (see Fig. 5):
- “Taking into account losses” - the choice is made relative to the point of intersection of the hydraulic curve graph and the practical pressure characteristic of the pumping unit;
- "Without taking into account losses" - the choice is made relative to the point of intersection of the hydraulic curve graph and the pressure characteristic of the pumping unit.
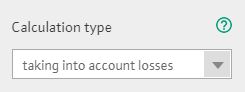
Fig. 6. Selecting the type of calculation
Station search
In the search line, you can search for:
- station name;
- station vendor code.
Enter a value and press "Enter" to initiate the search.
Fig. 7. Search line
Search is possible with incomplete input of the value specified in the field. For example, you can use part of the "CO 3 BL" or "240-18.5" item, or part of the "24533" vendor code. The table will show all matches with the specified value.
With the entered operating point, the search is not carried out over the entire database, but only among the obtained selection of suitable stations. The same goes for the filter section.
To filter data in the table, you can use the "Search section ", "Operating point value input section ", "Filter section "
Additional Search Features
By specifying a value in the search starting with "!" (for example, "! 15423") the station can be displayed by its identifier in the database.
Filter section
Filters allow you to specify additional search criteria:
- range of vendor codes;
- types of pumps;
- number of pumps;
- pipeline material;
- power;
- price.
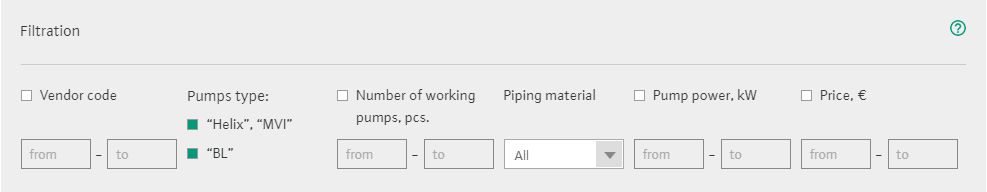
Fig. 8. Filter section
To filter the data in the table, you can use the "Search section ", "Operating point value input section " and "Filter section " simultaneously.
Table with a list of available stations
By default, the table displays all available stations. When you enter the operating point value, the table displays a selection of suitable stations.
Having selected one of the stations by pressing the left mouse button, it will be highlighted in blue. The graph will also display the pressure characteristic of this station.
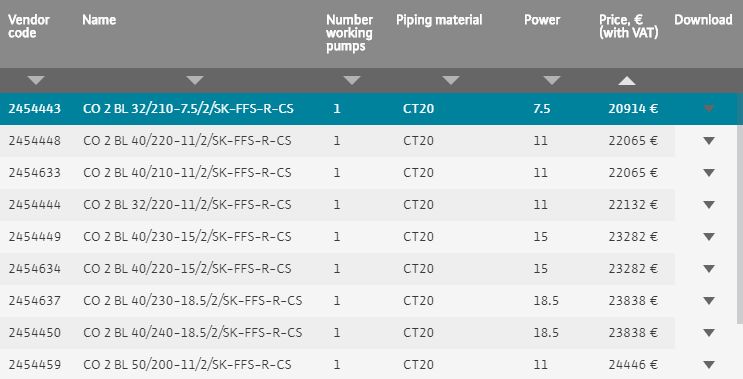
Fig. 9. Table with a list of suitable stations.
To select several stations in order to simultaneously display their characteristics on the graph, hold down the "Alt" key on the keyboard and left-click the desired stations in the table. You can select no more than 5 stations at a time.
When you click on the link to the station vendor code, a new tab will open displaying the data sheet for this station.
If at this moment the operating point is indicated, then the data list will contain not only the pressure characteristic of the station, but also the hydraulic curve.
Important! Your browser may ask you for confirmation to open pop-up windows, you need to allow it!
The data can be sorted by the following fields in the table:
- vendor code;
- number of working pumps;
- pipeline material;
- power;
- price.
To sort and select the sorting direction, click on the triangle icon under the corresponding table column headings. The direction of the triangle (up or down) indicates the direction of the sort.
When you click on the button in the "download" column, a menu with available for download data will be displayed:
- drawing in PDF format;
- DWG - format;
- 3D STEP model;
- Drawing in 3D DWG;
- Data list of the selected station in PDF format.